
CHAPTER - ONE
1.1 INTRODUCTION:
1.1.1 ORIGIN OF BANK:
In Thomson’s Dictionary of banking, it is
stated that the word bank is said to have
been derived from the Italian word “Banco”, which means a bench. The
early bankers, the Jews in Lombardy, transacted their business at benches in
the market place. One of the earliest Italian banks, the bank of Venice, was
originated for the management of a public loan, or “Monte”, as it was called.

The first bank called the “Bank of
Venice” was established in Venice, Italy in 1157 to finance the monarch in his
wars.
History tells us that it was the merchant
banker who first evolved the system of banking by trading in commodities than
money. Their trading activities required the remittances of money from one
place to another. For this, the issued different documents as the near
substitutes of money, called draft or hundis in modern days.
1.1.2. ORIGIN OF BANK IN NEPAL:
In Nepalese's perspective, raw banking
process started in 9th century i.e. 1879 A.D, when a Sudra merchant
of Kantipur named Shankhadhar after paying all the outstanding debts in the
country announced new era ' Nepal Sambat' with a view to build the valley.
Gunakamdev had borrowed the money during eight century in the period of Malla
regime of 11th century. There was an evidence of professional
moneylenders and bankers.
Like other countries gold smiths, merchants
and moneylenders were the ancient bankers Nepal. Tejarath Adda established
during the tenure of the then Prime Minister Ranodip Singh (B.S 1933) was the
first step towards the institutional development of banking in Nepal. Tejarath
Adda did not collect deposits from the public but gave loans to employees and
public against the bullion.
Banking in modern sense started with the
inception on Nepal Bank Limited (NBL) on B.S 1994.07.03. Nepal Bank Limited had
a Herculean responsibility of attraction people toward banking sector from pre-
dominated moneylenders net and of expanding banking service. Being a commercial
bank, it was natural that NBL paid more attention to profit generating business
and preferred opening branches at urban centers. Nepal Rastra Bank (NRB) was
set up on B.S 2022.10.10 as a fully government owned commercial bank. Since,
Aswin 1st 2002 B.S, the notes of 5,10 and 100 were brought into use
from Sadar Muluki Khana of HMG/N.
1.1.3. INTRODUCTION TO KUMARI BANK LTD.
Kumari
Bank Limited, came into existence as the fifteenth commercial bank by starting
its banking operations from Chaitra 21, 2057 B.S (April 03, 2001) with an
objective of providing competitive and modern banking services in Nepal.
Kumari
Bank Ltd has been providing wide- range of modern banking services through 6
points of representation across the country. The bank has adopted Globus
Banking Software, developed by Temenos NV, Switzerland, to provide centralized
data base system to all branches. The bank has also been providing visa debit
card, which has an access on ATMs (including 6 own ATMs) and POS (Point of
Sale) terminals both in Nepal and India.
Within 5 years of its establishment, the
bank has been able to recognize itself as an innovative and growing institution
striving to enhance customer value and satisfaction by backing transparent
business practice, professional management, corporate governance and total
quality management as the organizational mission.
Kumari Bank Ltd. has been always guided
with the philosophy “We do it”. It
has grown its branches in Kathmandu, Pokhara, Birgunj and Biratnagar. It is
planning to expand its branches in few other places in the near future.
1.1.4. INTRODUCTION TO LAXMI BANK LTD.
Laxmi Bank was incorporated in April 2002 as a commercial bank.
The current shareholding constitutes of promoters holding 55.42 percent,
Citizen Investment Trust holding 9.02 percent and the general public holding
35.56 percent. Promoters represent Nepal’s leading business families with
diversified business interests. The Bank’s shares are listed and actively
traded in the Nepalese Stock Exchange.
Laxmi Bank has grown with branches in Birgunj, Banepa, Pokhara,
Biratnagar, Narayanghat, Pulchowk Lalitpur and more recently Teku, Kathmandu.
Following the merger with Hisef Finance Ltd., a decade old first generation
finance company, its office in Hattisar, Kathmandu was converted to that of
Laxmi Bank. This office was converted to a full branch and our corporate office
in October 2005.
With a view to providing safe, seamless, quick and advance banking
services, the bank has been heavily investing in contemporary banking
technologies. The Bank uses Flexcube as its main banking platform. Flexcube
incidentally has been ranked the number one selling core banking solution
globally, and has been embraced by over 500 financial institutions across over
90 countries. The Bank provides its services through a host of delivery
channels including cell phone, Internet, ATM, Point of Sales (POS) etc., in
addition to a network of physical branches. Our Internet banking facility comes
with capabilities of online shopping in addition to regular Internet banking
features. Similarly, through the bank's alliance with Smart Choice Technologies
(SCT), the ATM/Debit cardholder of Laxmi Bank has access to a network of ATMs,
and POS terminals located in all major urban centers of the country. The bank
is the first in South Asia to have implemented SWIFT Net, the advanced version
of the SWIFT technology, which is used for speedy and secure payment and
messaging services.
Under a professional management team, the bank has established itself as an emerging key player. Today the bank is recognized as an innovative and progressive bank geared to providing shareholders and customers with quality earnings and value-added services. Transparency, good governance, and sound business growth are our driving forces.
Over a period of time, Laxmi Bank foresees itself to be one of the leading
banks in Nepal and eventually a niche player in the South Asian region.
The bank expects to achieve its overall
vision through the strength of its strong management pillars, which includes
professionalism, team spirit, customer focus, technology support, driven and
outward looking culture, good corporate governance, individual challenges and
empowerment.

Name Position
Mohan Gopal Khetan Chairman
Madhu Sudan Agrawal Director
Mr. C.P.Khetan Director
Gopi Krishna Sikaria Director
Mr. Nandan Hari Sharma Director
(Representing CIT)
Mr. Bhola B. Adhikary Director
(Representing Public Shareholders)
Mr. Rakesh Adukia Director
(Representing Public Shareholders)
Mr. Suman Joshi Chief
Executive Officer
Mr. Shambhu Prasad Acharya Professional
Director
Ratan Lal Shanghai Advisor
This study confirms the financial analysis of LBL and KBL. The present study analytically discloses the strengths and weaknesses of right company in relation to their financial performance. In essence, the current study throws light on financial analysis of KBL and LBL to draw due attention of new internee and management of commercial banks in order to aware them in their vital activities.
1.3. OBJECTIVES OF STUDY:
The primary objective of the research report is to provide us with an opportunity for learning as well as developing our managerial skills. Understanding financial problems and their underlying causes, we need to develop and evaluate potential solutions that optimize organizations' strengths, weaknesses, potential opportunities and competitive threats. As well as to assess and analyze the efficiencies and effectiveness of KBL and LBL in terms of their financial performance. The following are the specific objectives of this report writing:
1) To measure the ability of a firm to meet its short-term obligations and reflect the financial solvency of the firm.
2) To know the correlation between selected ratios and provide the necessary information for decision-making.
3) To access the efficiency as well as the financial position of LBL and KBL.
4) To provide information which in forecasting about future earning of organization.
5) To provide reliable financial information about economic resources and obligations of a business enterprises
6) To provide financial information that assists in estimating the earnings potential of the enterprises.
7) To provide details and information for shareholders, debenture holders, long-term investor and other short term investors.
8) To understand the nature of organizational problems in real life situations.
9) To develop managerial skills to tackle real life problems arising in organizations.
10) To develop appropriate managerial attitude and behavior of the students. which allow us to group our theoretical knowledge and ideas to the practical and real life practice.
11) To prepare students carry out managerial functions in future in different industries or organizations.
1.4. SIGNIFICANCE OF THE STUDY:
Development of banking system is a vital issue for the growth of the economy. The development of any bank depends upon the firm’s ability to pay its currently maturing obligation. Financial analysis identifies the financial strengths and weakness of the firm. The contributions of KBL and LBL need to be evaluated as it is functioning in our economy. Thus, present study deserves some significance of its own kind in its field. This study will be valuable to person and parties such as management of the bank, financial institutions, general public (depositors, investors etc), shareholders and other policymaking bodies, which are concerned with banking.
On the basis of the analysis, we determine the issues and gaps and thereby provide suggestions for the improvement on financial performance of KBL and LBL in the future.
1.5. STUDY METHODOLOGY:
Research Design
This
study is concerned with the detail analysis of the financial ratios of LBL and
KBL. The adopted method of research design is via
interview and the annual reports prepared by the concerned banks. It is
intensive study of the two enterprises. Historical data are collected from over
last few years and analyzed them according to set objectives of this study.
Sources of Data:
For the purpose of this study, required financial statements are collected from KBL and LBL. They are as follows:
a) Balance sheet.
b) Annual Report of KBL and LBL.
c) Income statement of KBL and LBL.
Analytical Procedure:
Various statistical tools are used
to derive concrete solution. Ratio, and percentage are calculated to make
effective study.
In respect of research procedure,
first of all combined balance sheet are prepared for study period with the help
of annual statement of KBL and LBL. Then, they are analyzed for the purpose of
measuring financial ratios.
Selection of Financial Ratios:
The ratios used for the study are as follows:
1) Liquidity ratio
2) Profitability Ratio
3) Credit Quality
4) Capital Adequacy
Methods of Data Collection:
This study is concerned with detail analysis of the financial ratios. Through these ratios we find out the financial position as well as the progress of the management of KBL and LBL. For this analysis the study makes use of secondary and primary sources of information.
Secondary data
Secondary Data were collected from various sources including annual reports of KBL and LBL from past few years. Banking and financial statistics, NRB Banking operations department and Nepal Rastra Bank economic report.
Primary data
Primary Sources of information were interviews with the staffs of the KBL and LBL, Corporate office, General Manager, Credit Manager, Trade finance Department Head, Marketing-Manager, Human Resource Manager, Account-officer, System Department Head, Internal Audit Department and staffs.
1.6. LIMITATIONS:
Besides this study following were limitations.
1) There is lack of financial resources to have a deep and large – scale study on the topic.
2) Data collection is one of the major problems of the study. This study is based on annual data, which are available in profit and loss account and balance sheet.
3) The study will be based on the data collected from the bank, magazine, books and annual reports.
4) Using the organization’s computer resource was almost impossible and no access to the organization’s internet was granted to be able to gain extra information due to privacy of the organization
5) The major limitation faced while conducting this study has been the small amount of the respondents from the banks’ departments and lack of quick accessibility of required reports of the banks.
CHAPTER – TWO
2.1 PRESENTATION OF DATA:
JOINT BALANCE SHEET OF KUMARI BANK LIMITED (KBL) AND LAXMI BANK LIMITED (LBL) AS AT 31ST ASHAD 2062(15TH JULY 2005).
KBL LBL
|
Capital and liabilities |
Amount (Rs) |
Amount (Rs) |
|
|
Share capital |
500,000,000 |
609,839,000 |
|
|
Reserve funds |
141,762,737 |
33,731,000 |
|
|
Borrowings |
401,761,328 |
18,691,000 |
|
|
Deposit accounts |
6,268,954,481 |
3,051,759,000 |
|
|
Bills payable |
7,339,236 |
- |
|
|
Other liabilities |
111,775,797 |
161,844,000 |
|
|
Income tax liability |
- |
10,315,000 |
|
|
Total capital and liabilities |
7,431,593,579 |
3,886,179,000 |
|
Assets
|
Amount (Rs) |
Amount (Rs) |
|
|
Cash & bank balance |
111,249,095 |
469,544,000 |
|
|
Balance with banks |
332,122,274 |
|
|
|
Money at call and short notice |
90,000,000 |
57,505,000 |
|
|
Investments |
1,190,271,012 |
410,939,000 |
|
|
Loan advances & bills purchase |
5,584,637,111 |
2,726,143,000 |
|
|
Fixed assets |
82,984,150 |
124,385,000 |
|
|
Other assets |
40,329,937 |
97,663,000 |
|
Total
assets
|
7,431,593,579 |
3,886,179,000 |
|
PROFIT AND LOSS ACCOUNT OF KBL FOR THE PERIOD OF 1ST SHRAWAN 2061 TO 31ST ASHAD 2062.
EXPENSES
|
AMOUNT (RS) |
|
Interest expenses |
240,130,179 |
|
Employee expenses |
42,395,007 |
|
Office overhead expenses |
71,812,004 |
|
Provision of loan losses |
47,399,804 |
|
Provision for staff bonus |
13,886,714 |
|
Provision for income tax and special
duty |
40,778,673 |
|
Net profit carried down |
84,201,757 |
Total
|
540,604,139 |
INCOME
|
AMOUNT (RS) |
|
Interest income |
499,918,465 |
|
Commission and discount |
23,083,001 |
|
Exchange gain |
14,988,827 |
|
Non operating income |
5,442 |
|
Other income |
2,608,404 |
Total
|
540,604,139 |
PROFIT AND LOSS APPROPRIATION ACCOUNT OF KBL FOR THE PERIOD OF 1ST SHRAWAN 2061 TO 31ST ASHAD 2062:
EXPENSES
|
AMOUNT (RS) |
|
General reserve fund |
17,576,111 |
|
Capital adjustment fund |
73,684,211 |
|
Accumulated profit |
7,961,400 |
Total
|
99,221,722 |
INCOME
|
AMOUNT (RS) |
|
Accumulated profit up to last year |
15,019,964 |
|
This year’s profit |
84,201,757 |
|
Total |
99,221,722 |
S.N.
|
PARTICULARS
|
AMOUNT (RS) |
|
1. |
Interest income |
214,132,000 |
|
2. |
Interest expenses |
118,439,000 |
|
(a) |
Net interest income (1-2) |
95,694,000 |
|
3. |
Fees, commission and discounts |
14,136,000 |
|
4. |
Other operating income |
7,597,000 |
|
5. |
Foreign exchange gain / loss |
5,770,000 |
|
(b) |
Total operating income (a+3+4+5) |
123,197,000 |
|
6. |
Staff expenses |
29,934,000 |
|
7. |
Other operating expenses |
38,201,000 |
|
(c) |
Operating profit before provision
(b-6-7) |
55,062,000 |
|
8. |
Provision for possible losses |
5,503,000 |
|
(d) |
Operating profit (c-8) |
49,559,000 |
|
9. |
Non operating income / expenses |
(9,102,000) |
|
(e) |
Profit from regular activities (d+9) |
40,457,000 |
|
(f) |
Profit before bonus & taxes (e) |
40,457,000 |
|
10. |
Provision for staff bonus |
3,678,000 |
|
11. |
Provision for tax |
10,315,000 |
|
(g) |
Net profit / loss (f-10-11) |
26,465,000 |
2.2. ANALYSIS OF DATA:
Financial statements are prepared with the help of financial transactions, which have placed during the financial year. It is prepared to provide the financial information that helps to take decision. But information provided in the financial statement is not an end as itself as no meaningful conclusion can be drawn from these statements alone. The information provided in financial statement is useful in marking decision through analysis and interpretation. Financial statements analysis is the process of identifying the financial strength and weakness of the firm by properly establishing relationship between the items of financial statement i.e. balance sheet, income statement. Among the Various methods or techniques used in analyzing the financial statement, ratio analysis is one of the most powerful tools of financial analysis. With the help of KBL & LBL’s balance sheet and P÷L account, their financial position will be analyzed and interpreted in this chapter. To achieve this objectives of the study, ratio analysis have been used to analyze the financial soundness of KBL & LBL because ratio analysis is a powerful and widely accepted tools to analyze the financial position of any company. Through it, economic and financial position of an organization can be examined.
Profit plays vital role for their survival and future growth. The profitability ratios reflect the operating efficiency. The relationship between profit and various assets of the organization is measured to analyze the operating strength of the company. The main objective of the commercial banks is to maximize the profit by providing the best services to the customers. The profitability ratio reflects the operating efficiency of the banks.
(a) Return on equity:
Return on equity, defined as net income
divided by equity, is the most direct measure of profitability. It is the
measure of income earned per dollar of the owner money that was committed. It
can be calculated using the following formula.
Return on equity (ROE) =Net Income ÷ Equity
KBL LBL
ROE=84201757 ÷ 500000000 ROE=26465000 ÷ 609839000
=0.168
=0.043
=16.8%
=4.3%

Here, the ROE of KBL is greater than that of LBL, so it is better to invest in KBL.
(b) Return on total assets:
Return on total assets equals net income
divided by total assets. It shows the percentage of income generated through
the assets of the financial institutions. It can be calculated through the
following formula. It is,
Return on total assets (ROTA) =Net Income ÷
Total Assets
KBL
LBL
ROTA=84201757 ÷ 7431593579 ROTA=26465000 ÷ 3886179000
=0.0113
=0.0068
=1.13%
=0.681%

(c) Equity capital ratio:
The equity capital ratio is defined as equity divided by the
total assets. Other things being equal, a lower equity capital ratio leads to
higher return on equity. Hence, the formula for its calculation is as follows,
Equity Capital Ratio (ECR) =Equity ÷
Total Assets
KBL
LBL
ECR=500000000 ÷ 7431593579 ECR=609839000 ÷ 3886179000
=0.067
=0.156
=6.7%
=15.6%

(d) Spread:
Spread is net interest revenue divided by
total assets. Net interest revenue is interest plus loan fee income, minus
interest expenses. Spread is followed more closely than either interest income
or interest expenses as a percentage of total assets because interest income
and interest expenses both change with the changes in the general level of
interest rates. The profitability question of interest is the spread between
interest income and interest expenses. It can be calculated as follows,
Spread = Net Interest Income ÷ Total
Assets
[Where net interest income=interest income
– interest paid]
KBL
Spread=259788286 ÷ 7431593579 [net
interest income=499918465 - 240130179]
=0.0349 =259788286
=3.49%
LBL
Spread=95694000 ÷ 3886179000
=0.0246
=2.46%

(e) Interest income ratio:
It is the percentage of interest income
over total assets. Increasing interest income ratio is beneficial for the
financial institutions. Increase in income interest ratio is the sign of sound
financial performance.
Interest Income Ratio (IIR) =Interest Income ÷ Total Assets
KBL
LBL
IIR =499918465 ÷ 7431593579 IIR =214132000 ÷ 3886179000
=0.0672
=0.0551
=6.72%
=5.51%

(f)
Interest expenses ratio:
Interest expenses ratio equals interest expenses divided by the total
assets of the business firm. Decreasing interest expenses ratio is the symbol
of good operation of any institutions. The formula for its calculation is,
Interest
Expenses Ratio (IER) = Interest Expenses ÷ Total Assets
KBL
LBL
IER=240130179
÷ 7431593579
IER=118439000 ÷ 3886179000
= 0.0323
=0.030
=3.23%
=3.04%

2.2.2. LIQUIDITY
Liquidity refers to the ability to meet the obligations as they come due. It is extremely essential for a firm to be able to meet its obligation. Liquidity ratios measure the ability of the firm to meet its current obligation. Liquidity is a pre-requisite for the very survival of a firm. In fact analysis of liquidity needs the preparation of cash budgets and cash and fund flow statement, but liquidity ratios by establishing a relationship between cash and other current assets to current obligations, provide a quick measures of liquidity. The failure of the company to meet its obligations due to lack of sufficient liquidity, will result in poor credit worthiness, loss of creditor’s confidence or even in legal tangles resulting in the closure of the company. A very high degree of liquidity is also bad, idle assets earn nothing. The firm’s fund will be unnecessarily tied up in assets. Therefore, it is necessary to strike a proper balance between current assets and current liabilities. Generally, excess of current assets over current liabilities is considered as favorable. But highly liquid and lack of liquidity are both dangerous for the firm. Therefore, there should be proper balance between liquidity and illiquidity.
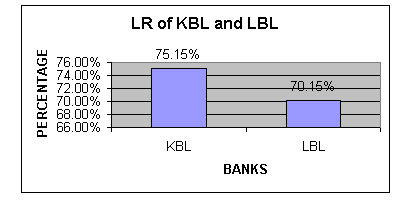
(a) Loan ratio:
Loans are non-liquid
assets. Most loans cannot be sold and must be held until maturity. Thus, a high
ratio of loans to total assets means low liquidity. On the other hand, loans
are generally the most profitable assets, so a high ratio of loans to total
assets generally contributes to profitability. It is calculated as under.
Loan Ratio (LR) = Net Loans and Advances ÷
Total Assets
KBL LBL
LR = 5584637111 ÷ 7431563579 LR = 2726143000 ÷ 3886179000
= 75.15% = 70.15%
(b) Purchased liabilities to total assets ratio:
Purchased liabilities are the short-term funds raised in the
highly impersonal money markets. Purchased liabilities, also called hot
money, are considered to be the major demand on liquidity. Purchased
liabilities mature quickly, and the financial institutions plan on selling new
short-term securities to replace maturing securities. It is generally computed
by the following formula,
Purchased liabilities to total
assets ratio = purchased liabilities÷ total assets
Higher the credit purchase ratio,
higher is the liquidity and vice versa.
(c) Investments maturing in less than 1 year to total assets:
Investments maturing in less than one
year can generally be sold quickly with little or no loss in value if
additional funds are needed. Thus, the quantity of these assets is one source
of liquidity. Higher investment maturing in less than one year shows higher
liquidity and vice versa.
2.2.3. CREDIT QUALITY
Defaults on loans are
one of the major risks faced by financial institutions. Profits are generally
less than 1 percent of total loans, so the cushion with which to absorb loan
losses is small. Furthermore, equity is often as low as a few percent of
assets, providing little cushion from that source.
It is difficult to measure credit quality
using financial statement information, but some insights can be gained through
ratio analysis.
(a) Credit loss provision ratio:
The ratio of credit
loss provisions to total assets is one such measure. This ratio must be
interpreted in light of other information of the company. Increase in credit
loss provision increases safety but results in the decrement of credit quality.
Hence, we calculate by the following formula,
Credit Loss Provision Ratio
= Credit Loss Provision ÷ Total Assets
Credit Loss Provision Ratio = 47399804 ÷ 7431563579
= 0.638%
LBL
Credit Loss Provision Ratio = 5503000 ÷ 3886179000
= 0.141%

(b) Credit loss coverage ratio:
The credit loss coverage measures the margin for error provided by income. A high credit loss provision means a greater margin for error and therefore more safety. However, the decline in the coverage ratio in this particular case must be interpreted in light of that fact that a more conservative approach to loan losses provisions has been adopted. An examination of credit loss reserves complements the examination of credit loss coverage.
Credit Loss Coverage = [EBT + Credit Loss Provision] ÷ Total
Assets
KBL
Credit Loss Coverage =
[43423084 + 47399804] ÷ 7431563579
= 0.0122
LBL
Credit Loss Coverage = 40457000 ÷ 3886179000
= 0.010

(c) Credit loss reserves ratio:
When the bank decides it will not be able to collect a loan, the
loan is written off and that amount is deducted from the credit loss reserve.
The ratio of credit loss reserves to total assets is a measure of the percent
of assets that can be declared uncollectable without having to reduce income.
This is another measure of the cushion for covering loan losses. We calculate
this ratio by the formula,
Credit loss reserves ratio=
credit loss reserves ÷ total assets
(d) Net credit losses ratio:
Net credit losses are the amounts actually written off
during the year as uncollectable, minus any previously written off loans that
were collected during the year. Net credit losses increased, which would
indicate decreasing quality of the loan portfolio. It can be calculated using
the following formula,
Net credit losses ratio= net credit
losses ÷ total assets
2.2.4. CAPITAL ADEQUACY:
Capital provides protection for depositors and other creditors in the event that assets decline in value or the financial institution suffers losses. There are several definitions of capital, depending on the regulatory agency involved. Some of these measures include loan loss reserves, redeemable preferred stock, and certain qualified debt instruments.
Here, equity capital ratio is
calculated to detect the capital adequacy of the firm. It can be calculated by
using the following formula,

3.1. SUMMARY AND CONCLUSIONS:
This report attempts to examine and evaluate the
financial performance of with special reference to Capital
and Assets structure and
to recommend some concrete suggestion packages for improvement in view from financial
analysis. The financial statement of the year 2062B.S.
has been taken into consideration for the purpose of this study, which has been
first processed and analyzed comparatively. Individual interview with the
management has been taken wherever necessary. This study is exploratory as well
as analytical to some extent. The main objective of this research is not
only to point out the faults and errors but also provide sound directions for
further improvement.
The
bank's financial performance seems to be pretty sound and successful. From the
current scenario, the role of bank in maintaining financial status and monetary
standard is satisfactory.
3.2. RECOMMENDATIONS:
Based on the financial analysis and the observation of study, following recommendation is suggested to overcome the weakness and inefficiency and to improve the present financial performance of KBL & LBL.
Ø Profit is essential and crucial part of any business .So to increase profit both banks should minimize its operating costs by increasing the operating efficiency of their employees.
Ø The banks should change its investment pattern, i.e. it should not invest in secured assets but also try to invest in other areas of development, which helps in total development of the economy.
Ø The banks should investigate the new productive sectors other than exiting ones and invest in such new sectors which creates pressure on banks management to cope with the country’s economic activities which eventually helps the bank to enhance the economic development of the country as well its own profitability.
Ø Mostly joint venture banks are concentrating their focus only in urban areas, which is unfair in practice. The need of the small communities and borrowers outside these areas are neglected .So, the banks should expand their branches in rural areas too. Due to the branch expansion the banks will be able to collect more deposits from the scattered and small investors and investment requirements of rural areas may be fulfilled.
Ø Designing efficient organizational structure keeping in view of productivity of management and also emphasizing on professionalism in the management.
Ø Motivating the employees through various ways such as sending them on training program, access to information of the required queries, appropriate manpower planning- “The right man for right place policy” which also reduces unnecessary operating expenses of the bank.
Ø Focusing more on income generation activities like issuance of pay order, traveler’s cheques, document sent for collection, remittance (fund transfer) also helps greatly to the bank in earning income.
Ø Identification of source of fund accessible to the bank where cost of fund has to be minimum and likely returns to be high. Implementations of sound investment policy- in which deposited cash are distributed on different types of assets with good profitability in return provide maximum safety and security to the depositors and bank itself.
Ø It is also advisable to LBL & KBL to inspire small entrepreneurs as well, where the risk of loan will be minimum.
Ø It is noted that banks most resource flows to private sector, which makes the other sector behind in their performance. So, KBL & LBL should divert its resources to agricultural, priority and deprived sector as per NRB directives.
|
|
KBL |
LBL |
|
Profitability
ratio |
|
|
ROE
|
16.8% |
4.3% |
|
ROTA |
1.13% |
0.68% |
|
ECR |
6.7% |
15.6% |
|
SPREAD |
3.49% |
2.45% |
|
IIR |
6.72% |
5.51% |
|
IER |
3.23% |
3.04% |
|
Liquidity
ratio |
|
|
|
LR |
75.15% |
70.15% |
|
Credit
quality |
|
|
|
CLPR |
0.638% |
0.141% |
|
CLCR |
0.122% |
0.010% |
|
Capital adequacy ratio |
12.32% |
13.54% |


